Disproportionate Exposure to Urban Heat Islands
An analysis of socioeconomic status in Portland, Oregon
Introduction
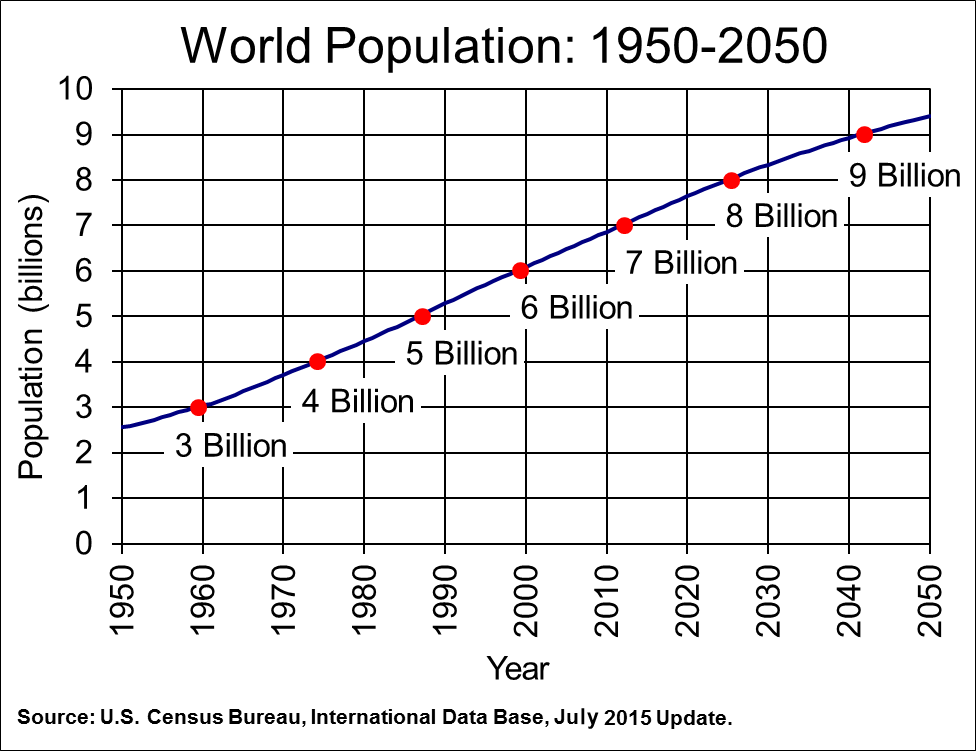
By 2050 we will see an addition 2.5 billion people living in urban environments (United Nations, 2015).
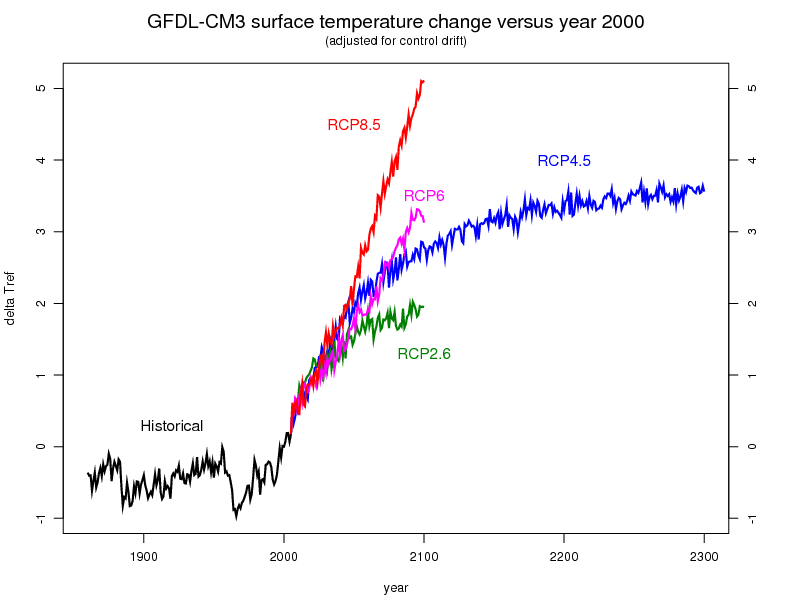
Global temperatures are rising - current models predict increases of up to 5.7°C for the Pacific Northwest (Mote & Salathé Jr., 2010).
Worldwide economic damages from just 1°C rise in global temperatures could be as much as 448 billion USD (Tol, 2002).
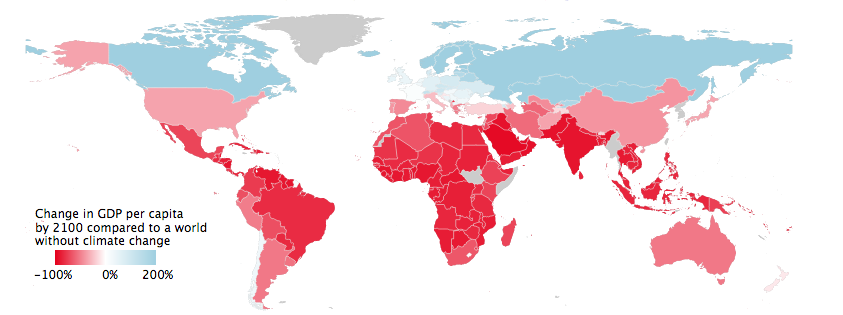
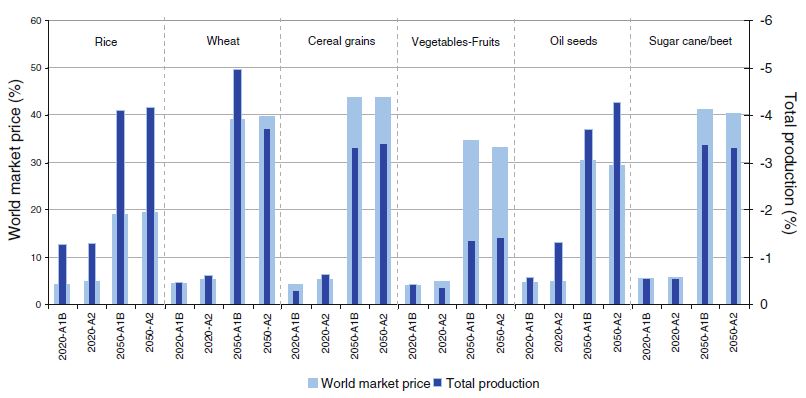
Climate change is expected to reduce global food production by ~2.3% by the 2050s due to stress on agricultural systems (Calzadilla et al., 2013).
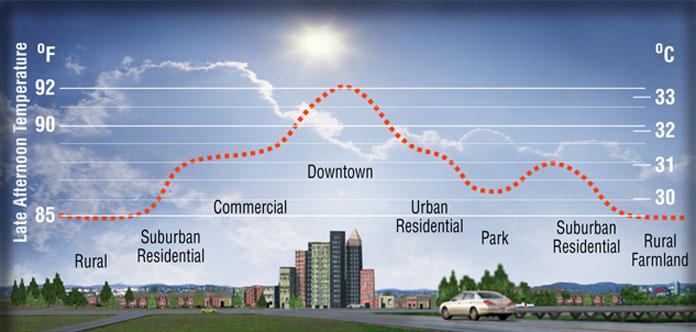
Urban Heat Islands (UHI)
- Date back to the early 1800's (Howard, 1820)
- Intra-urban temperatures
- High spatial variability
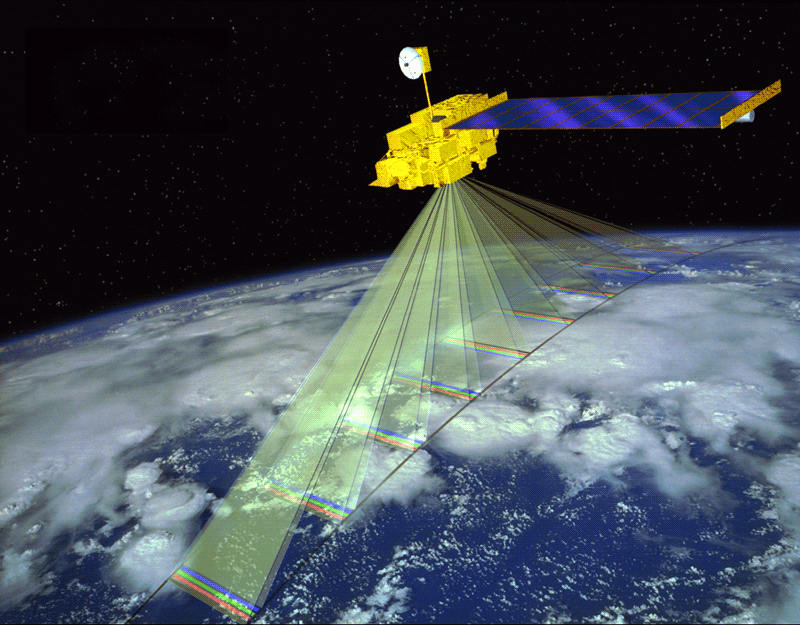
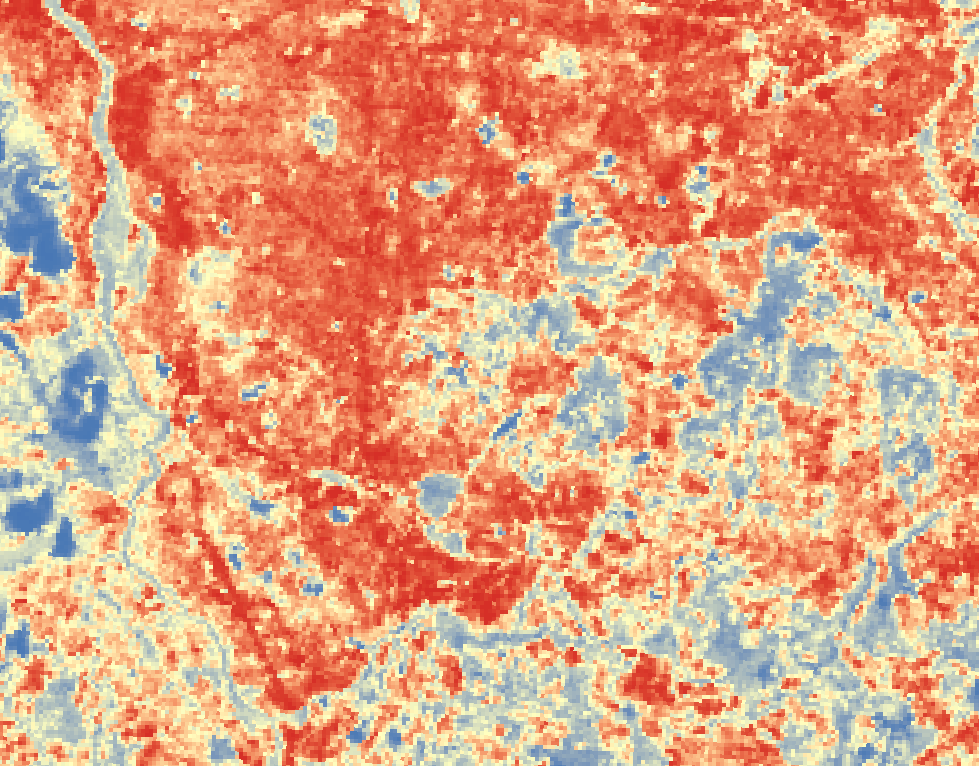
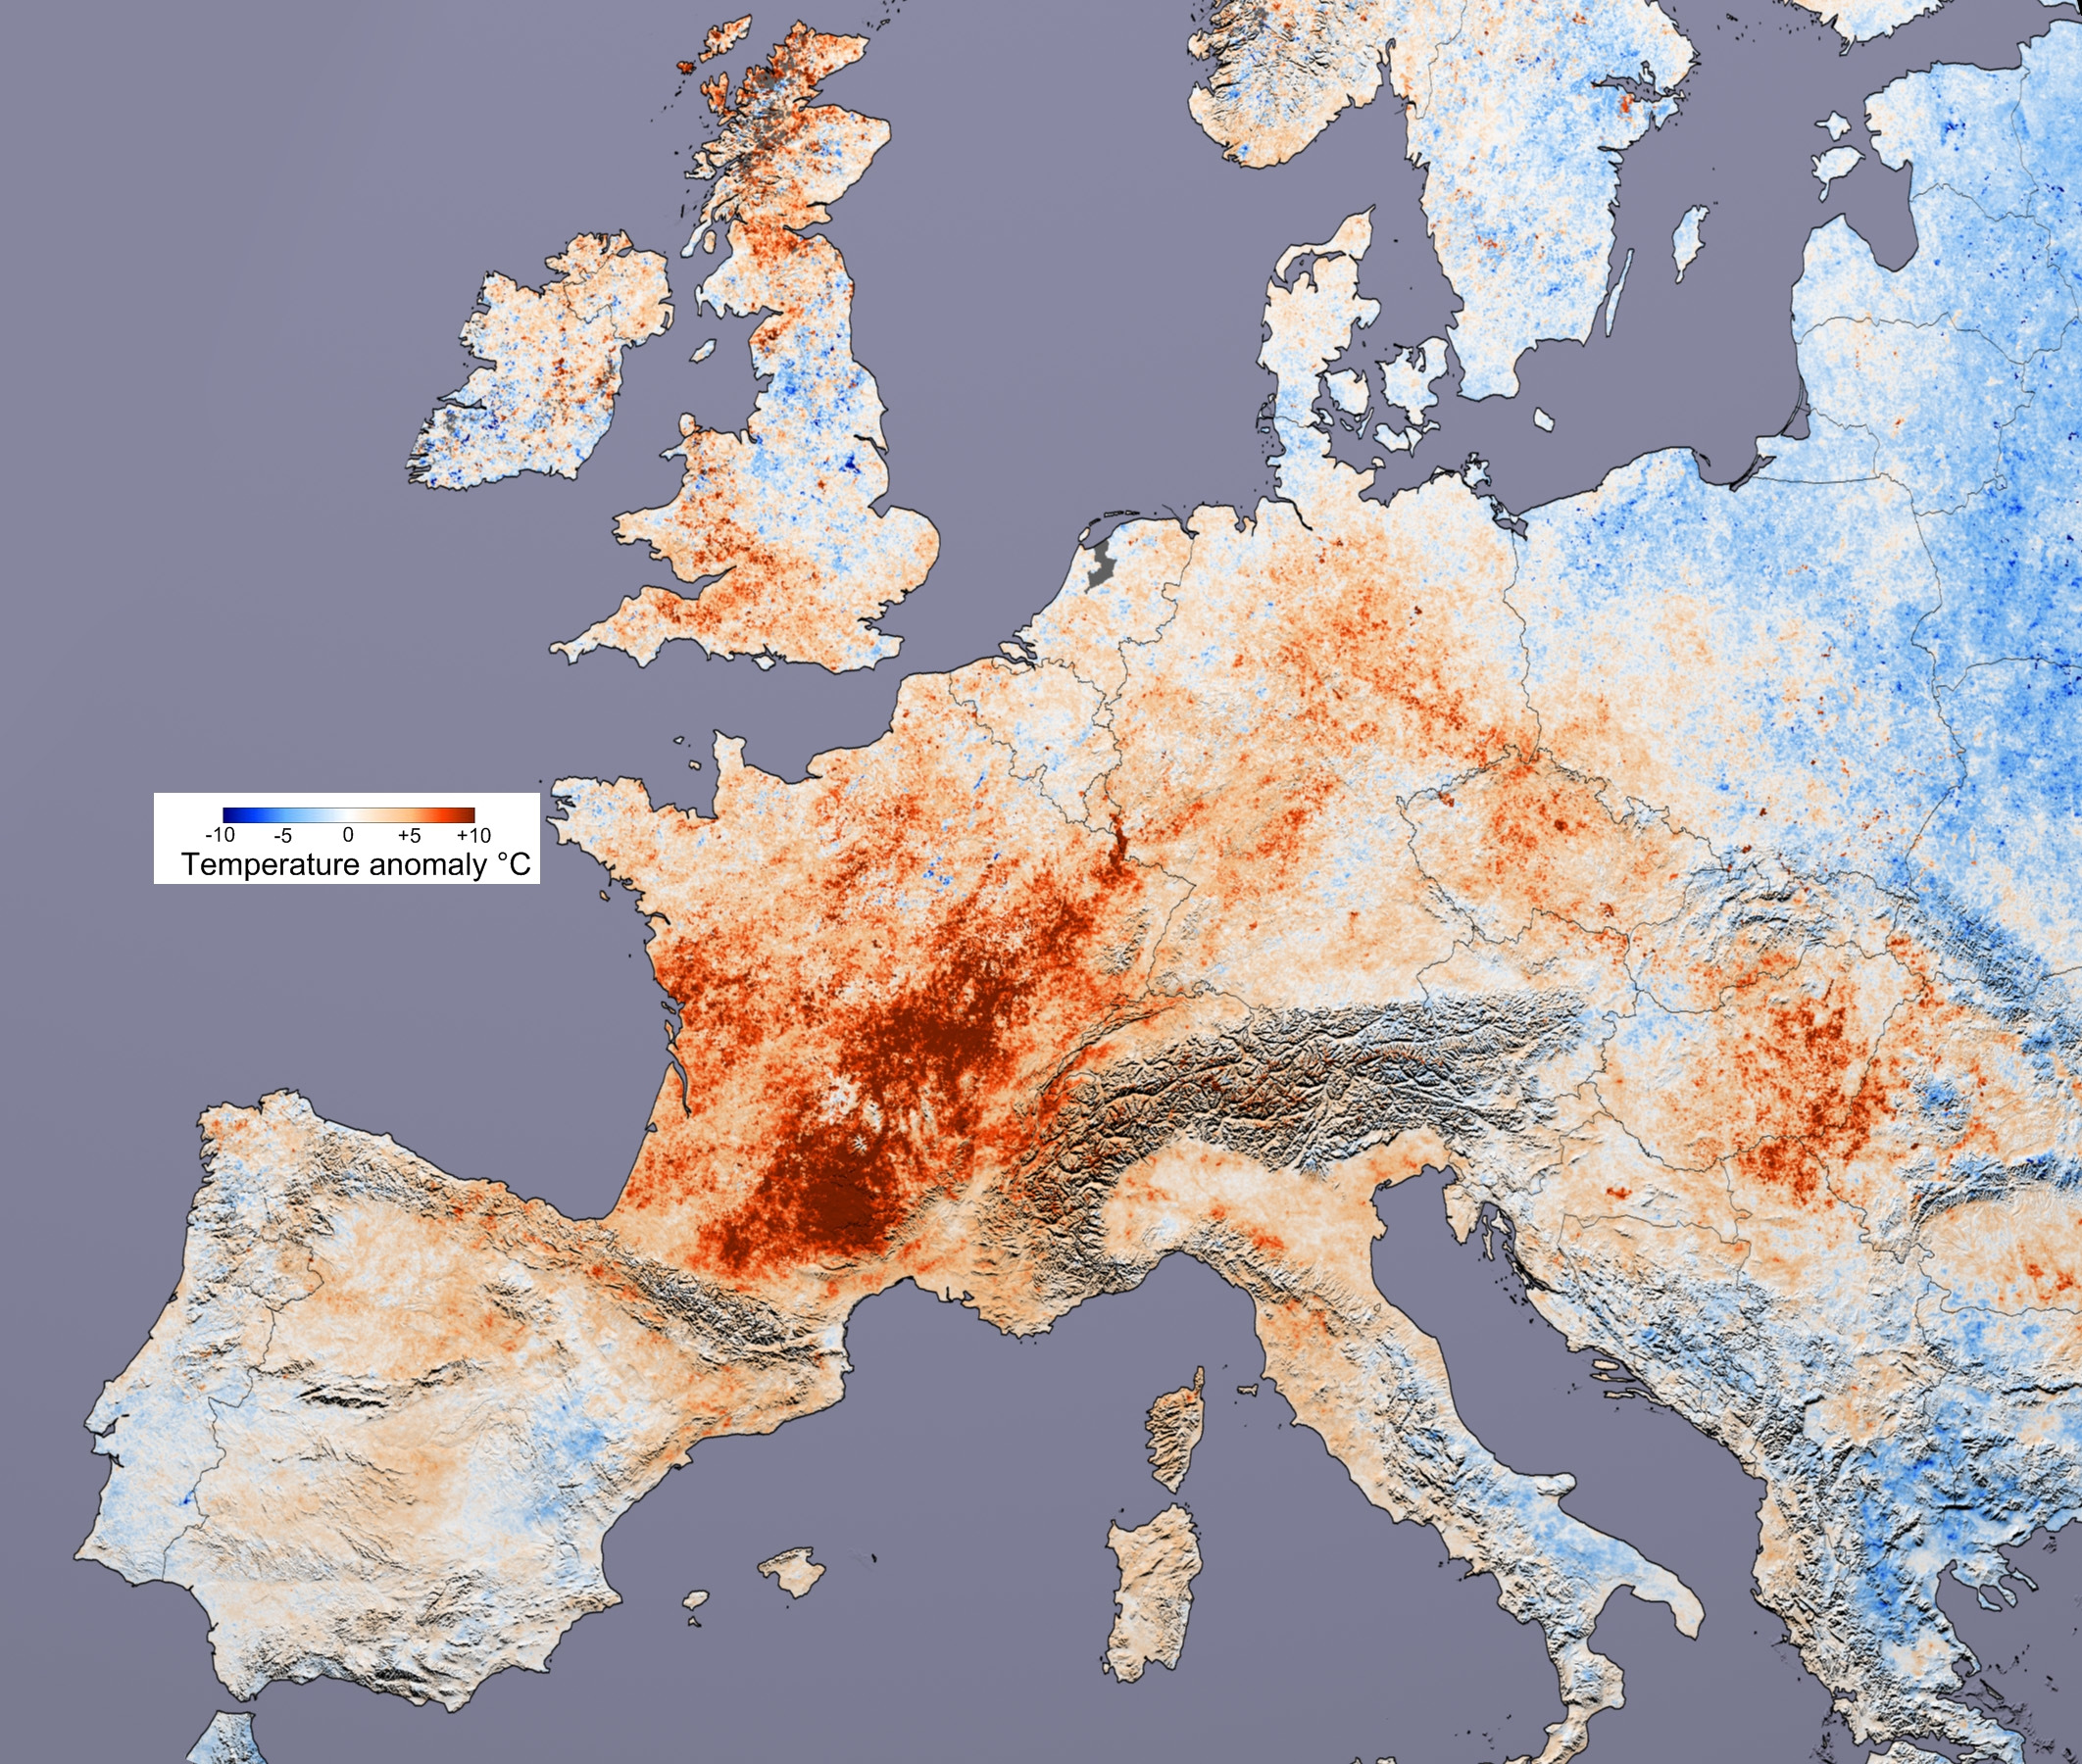
Satellite-based UHI Descriptions
-
Source: (left) Langley Research Center, NASA. (right) AST08 Data, Portland, Oregon.
- Free
- Reputable - Ubiquitous Use
- Easily Accessible
Satellite-based UHI Descriptions
- Cons:
- Poor Resolution (Sobrino, Oltra-Carrió, Sòria, Bianchi, & Paganini, 2012)
- Documented Inaccuracies (Song, Park, Song, & Park, 2014)
Vehicular Traverse-based UHI Descriptions
Dates back to before satellites.
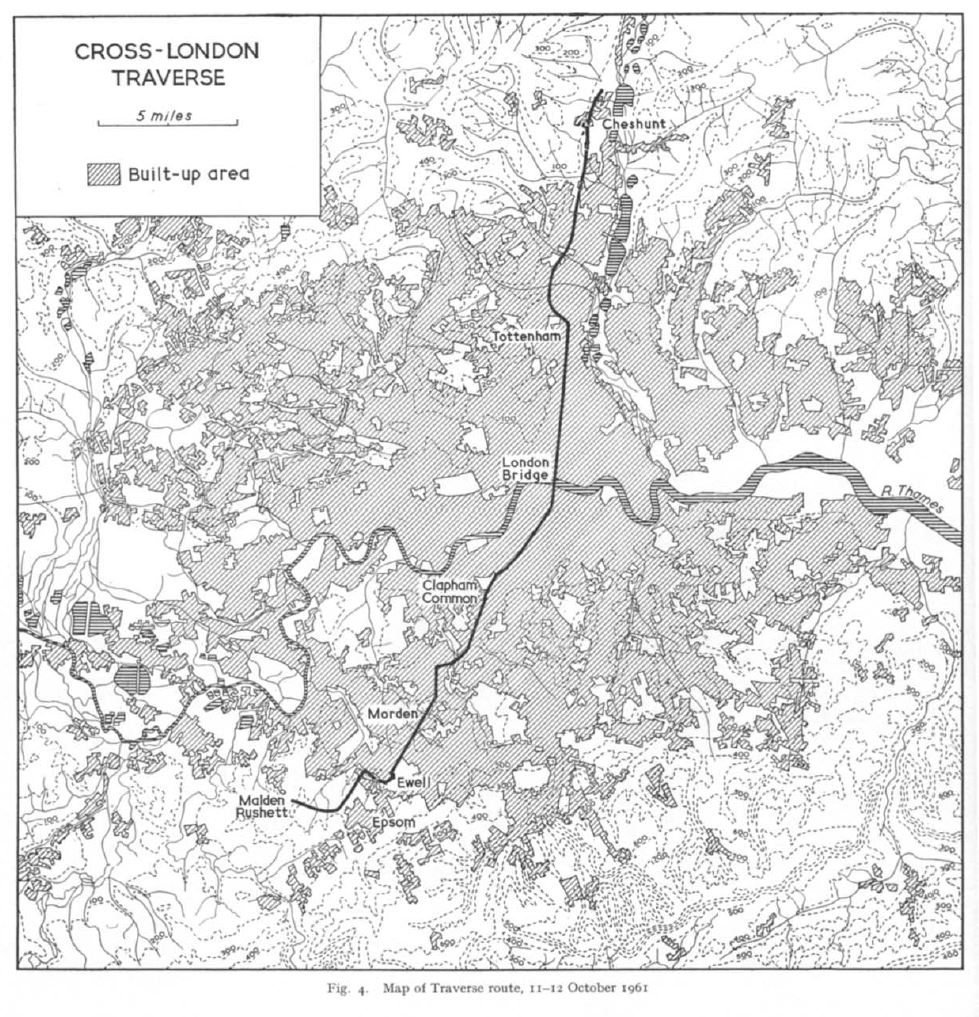
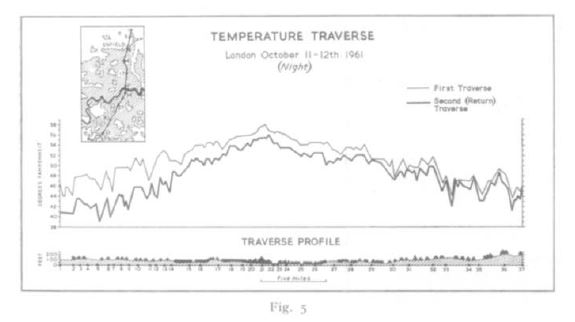
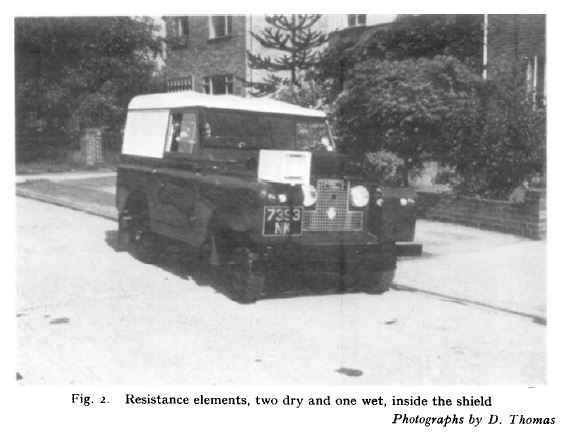


Concept: many in situ measurements. Today, computers can model relationships.
Data
Health and Heat
- Hidden Killer, #1 natural hazard in post-industrial societies (Poumadère, Mays, Le Mer, & Blong, 2005)
- Intra-urban temperatures
- High spatial variability
Other studies have shown that marginalized populations tend to experience more exposure to temperature (Huang, Zhou, & Cadenasso, 2011).
Are people experiencing the same temperatures in Portland, Oregon?
Are marginalized and lower socioecnomic status populations experiencing higher temperatures in Portland, Oregon?
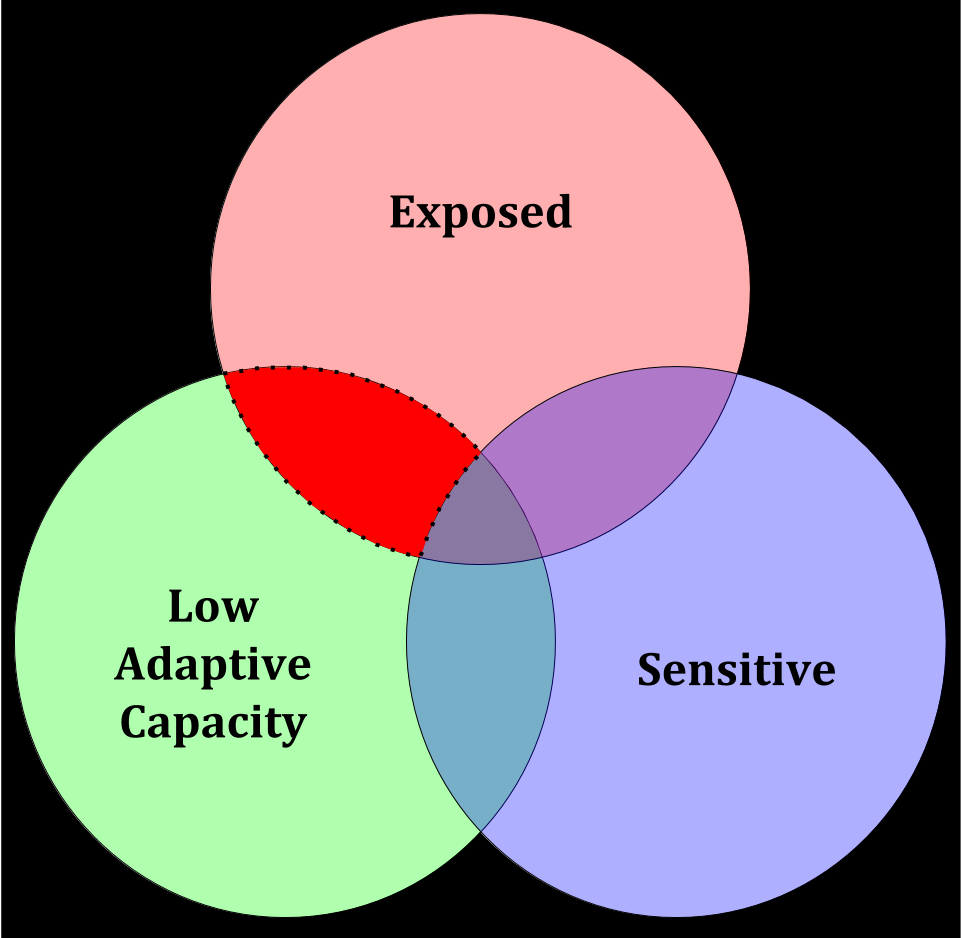
Background
Vulnerability: Conceptual Framework
- Exposure
- Sensitivity
- Adaptive Capacity
Source: Turner et al. (2003).
Exposure
Direct contact to stressor by individual or population/subpopulation.
ie live/work in degraded environments
Sensitivity
Intrinsic: fixed characteristic
ie genetics, age
Acquired: adopted characteristic
ie tobacco/alcohol use, exercise
Source: Sexton (1997).
Adaptive Capacity
Ability to cope with - or understand the presence of - degraded environments.
ie income, race, individual sociality, social cohesion
Source: Yohe & Tol (2002), Grothmann & Patt (2005), Semenza et al. (1996).
Assessing Vulnerability
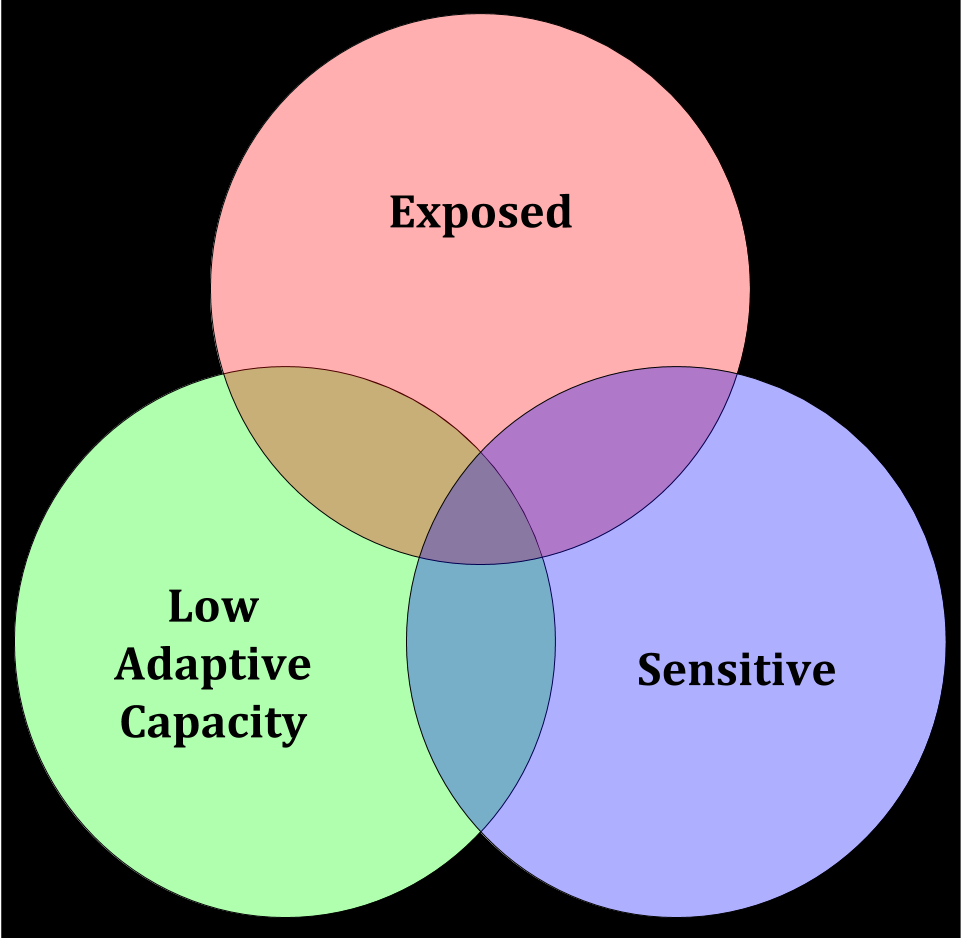
Why look for this area betwee adaptive capacity and exposure?
Morbidity, Mortality, and Disproportionate Exposure
Socioeconomic Status drives mobidity and mortality arcoss environmental stressors.
Source: Adler et al. (1994); Kershaw, Gower, Rinner, & Campbell (2013); Polednak (1989).Direct link between mortality and income
Source: Graham, Chang, & Evans (1992).Environmental Justice
Environmental justice is the fair treatment and meaningful involvement of all people regardless of race, color, national origin, or income, with respect to the development, implementation, and enforcement of environmental laws, regulations, and policies.Source: United States Environmental Protection Agency (2010).
Hypothesis
People with low adaptive capacity are experiencing hotter urban temperatures than their high adaptive capacity counterparts.
- Measured through:
- Socioeconomic status (SES)
- Affordable Housing Placement
Methods: Data
Study Area
Portland, Oregon
Datasets
Urabn Heat Island Model
- Source: Sustaining Urban Places Research Lab
- Traverse-based
- Coverage: City of Portland
- Resolution: 1m
- Time: 7pm (chosen over 6am and 3pm)
Urabn Heat Island Model
Census Geometries
- Source: United States Census Bureau
- Block Groups
- American Community Survey
- Embeded sociodemographics
Census Geometries
Combining Census and Temperature Datasets
Zonal Statistics
- Calculates statistics for raster cells that fall within a single or multiple polygons
- Standard practice, even for UHI work (Huang, Zhou, & Cadenasso, 2011).

Combining Census and Temperature Datasets
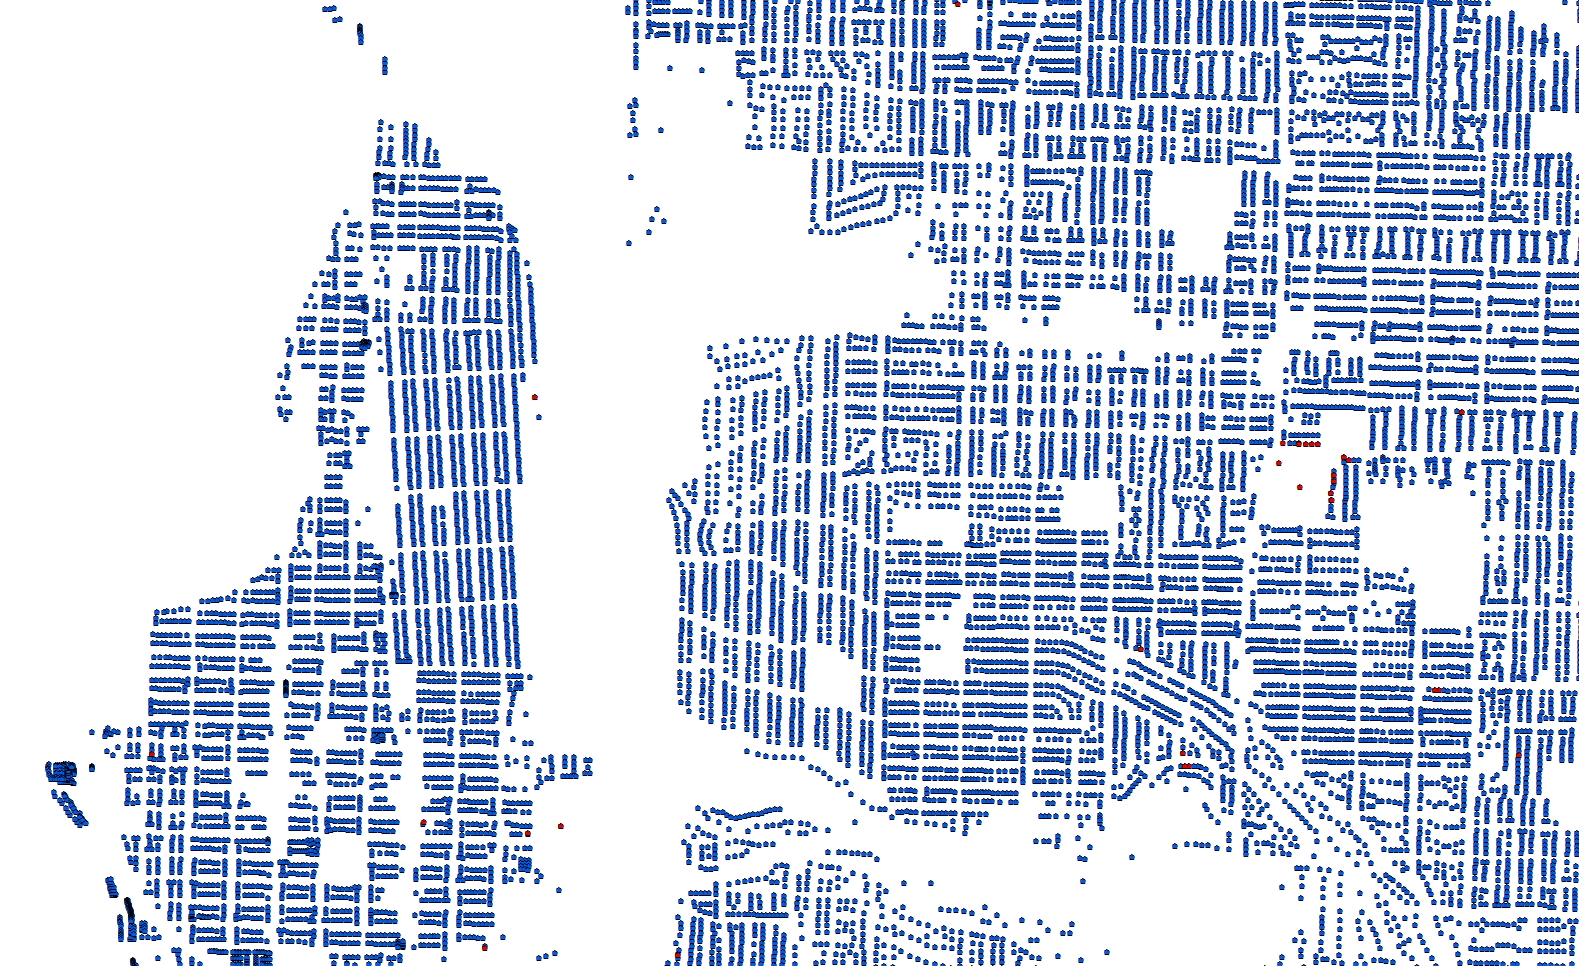
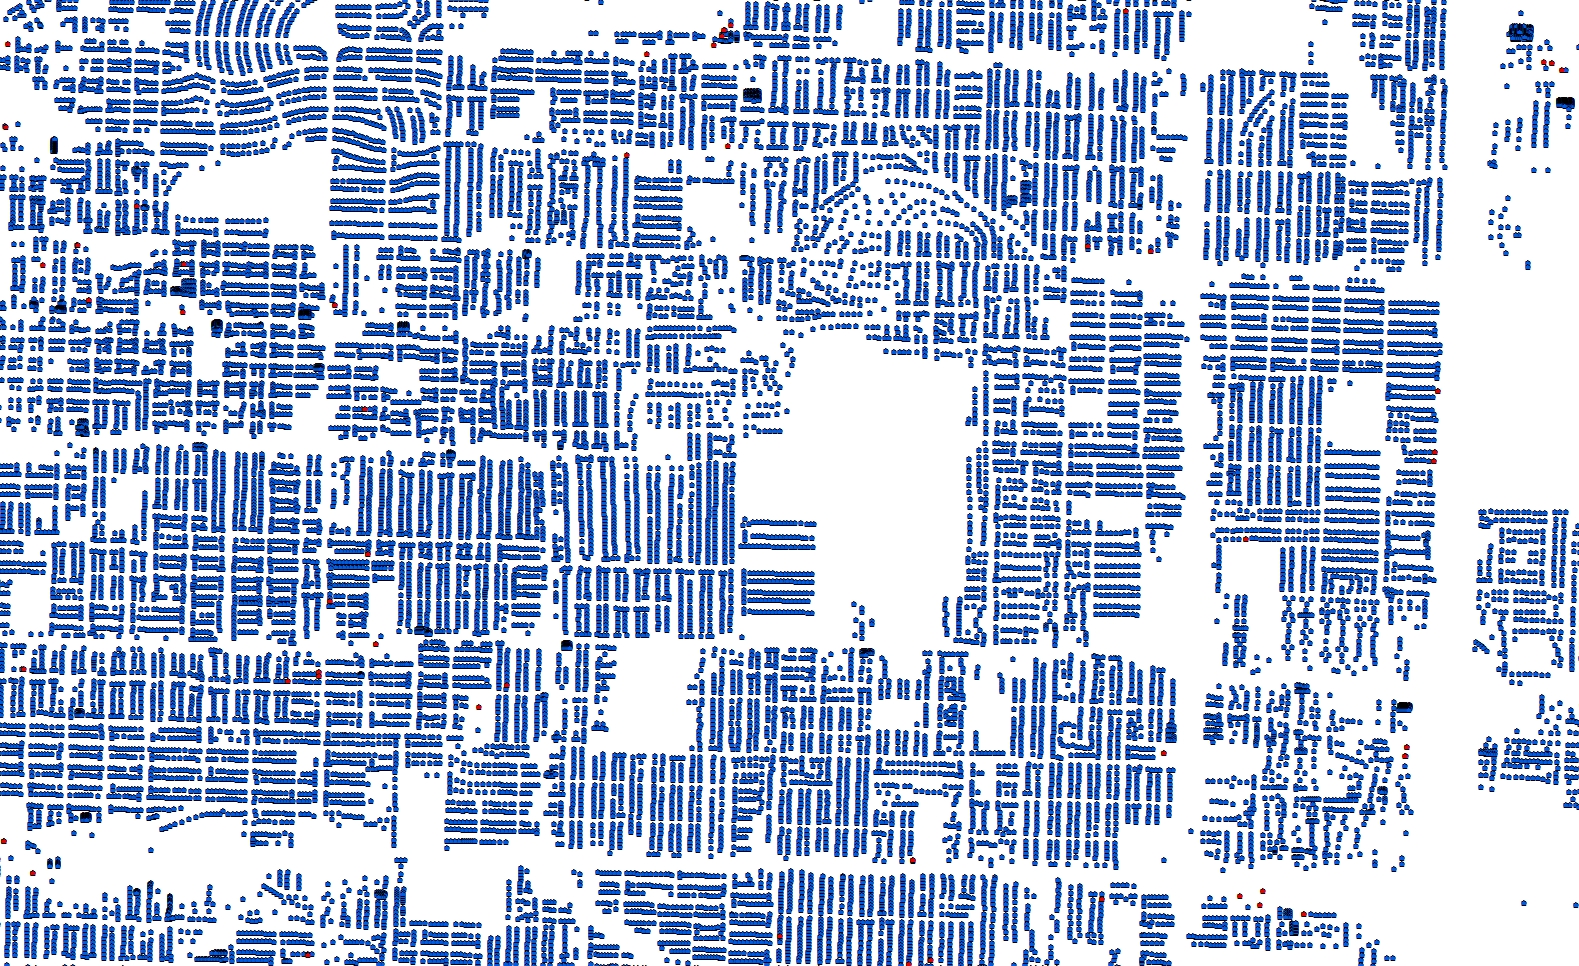
Affordable Housing
- Source: Oregon Metro Regional Land Information System (RLIS)
- HUD data, Section 8, etc.
Affordable Housing
All Buildings
- Source: Oregon Metro Regional Land Information System (RLIS)
- Building-level vector data
- Intrinsic use data (residential, industrial, etc.)
City Boundaries
- Source: Oregon Metro Regional Land Information System (RLIS)
- Cities in the region
- Extracted the City of Portland
Methods: Analyses
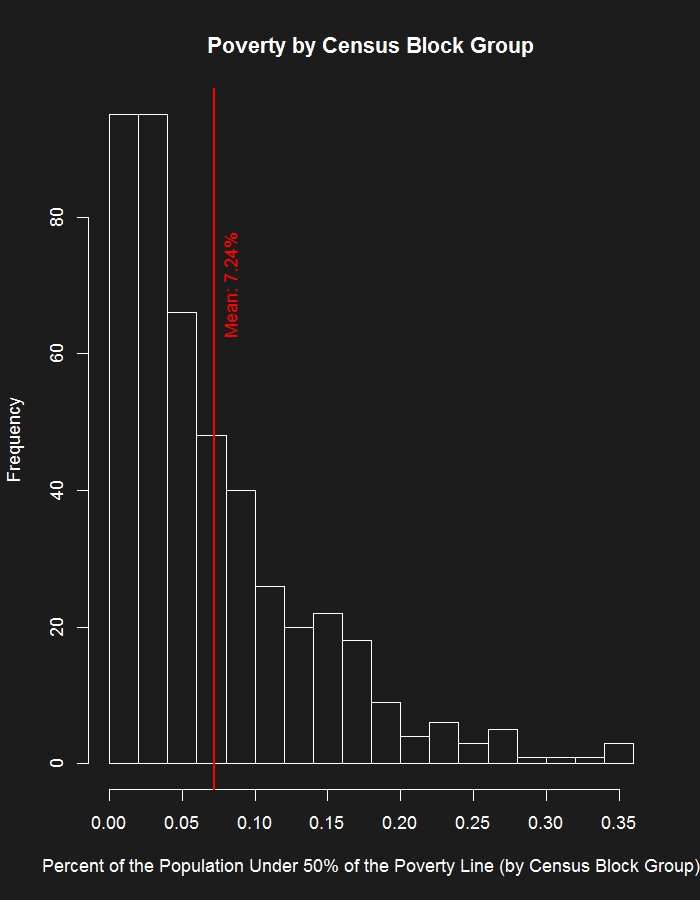
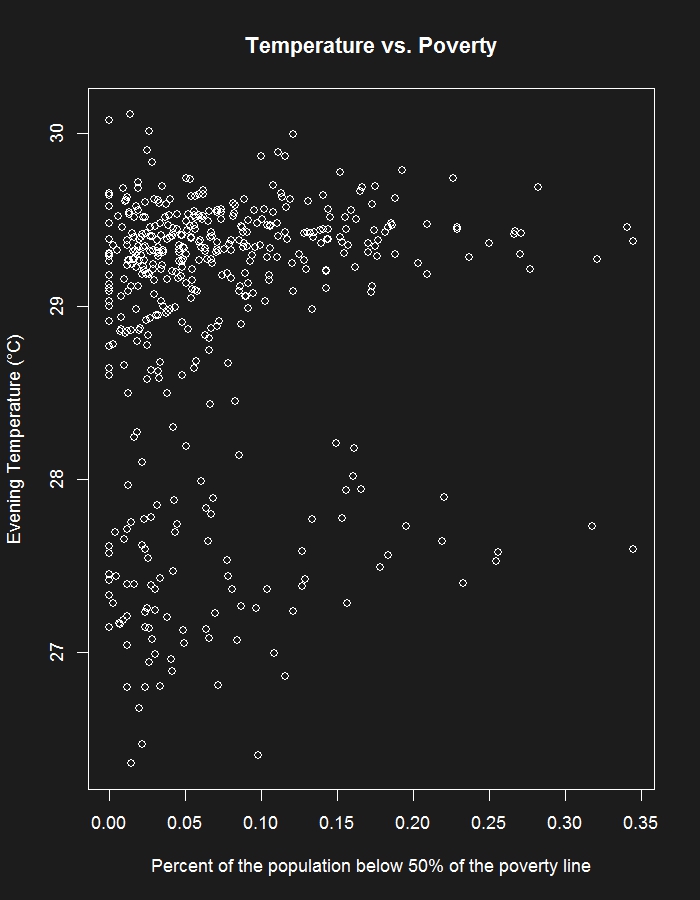
Income
Income: Geographic Distribution
Income: Hypothesis
$H_{0}$: $\mu_{Low \space Income} - \mu_{High \space Income} = 0$
$H_{1}$: $\mu_{Low \space Income} - \mu_{High \space Income} > 0$
$\alpha$ = $0.05$
Where:
$\mu_{Low \space Income}$ = Mean temperature of low income block groups
$\mu_{High \space Income}$ = Mean temperature of high income block groups
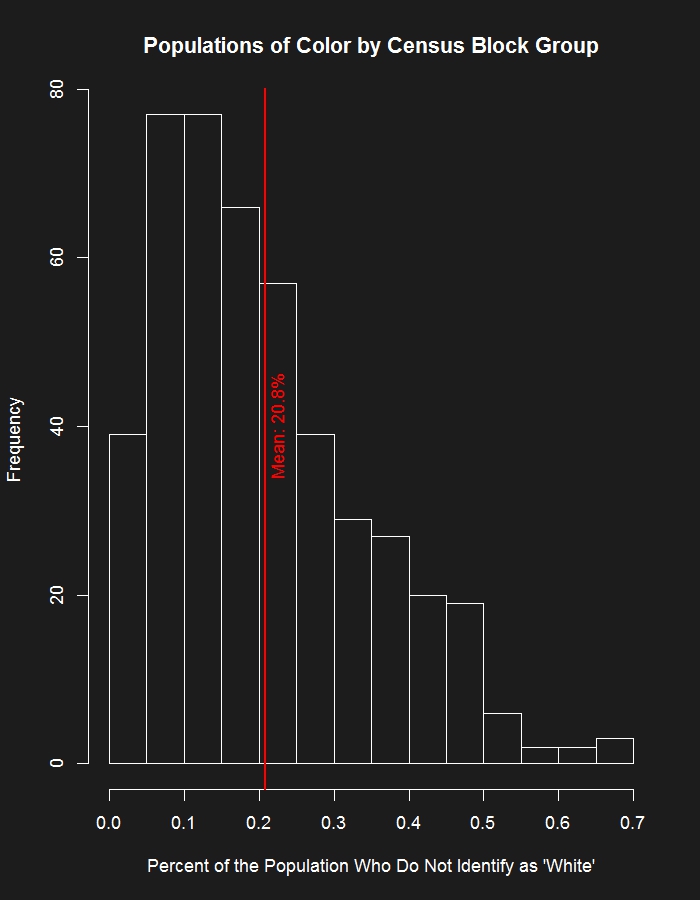
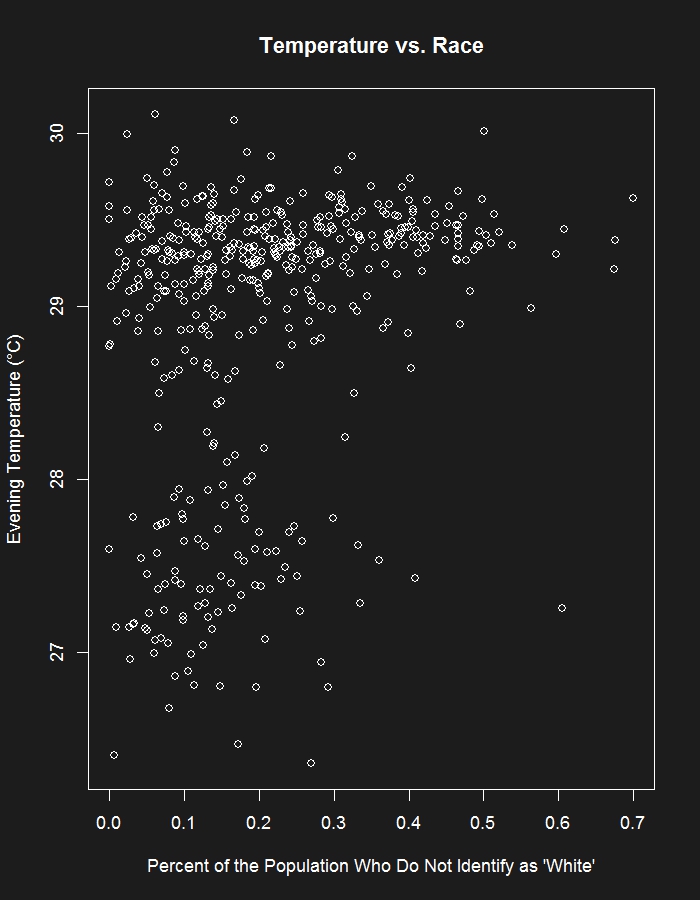
Populations of Color
Populations of Color: Geographic Distribution
Populations of Color: Hypothesis
$H_{0}$: $\mu_{Non \space White} - \mu_{White} = 0$
$H_{1}$: $\mu_{Non \space White} - \mu_{White} > 0$
$\alpha$ = $0.05$
Where:
$\mu_{Non \space White}$ = Mean temperature of block groups with large population of color
$\mu_{White}$ = Mean temperature of block groups with small population of color
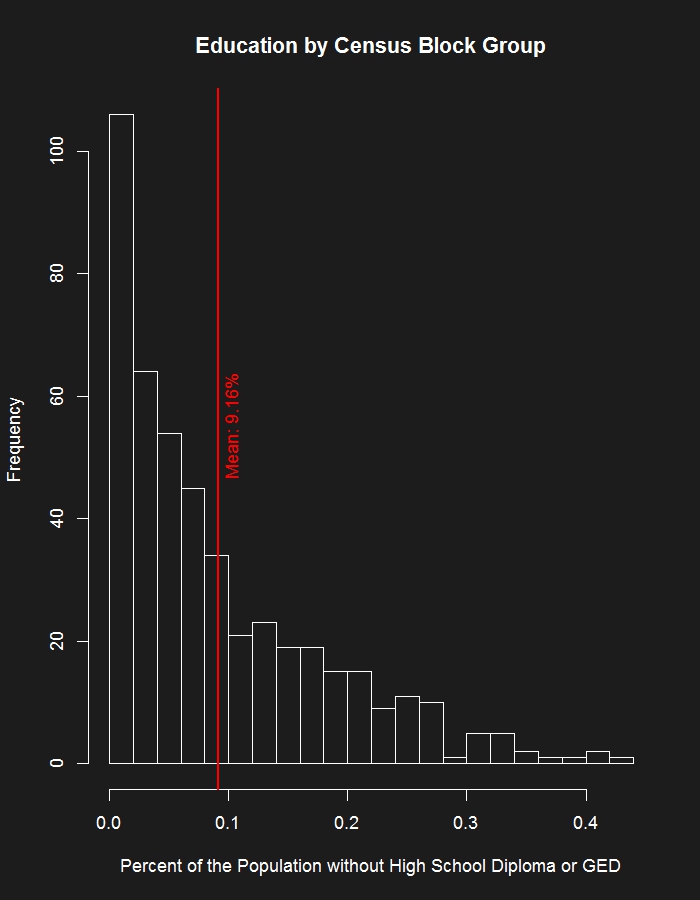
Education
Education: Geographic Distribution
Education: Hypothesis
$H_{0}$: $\mu_{Low \space Edu} - \mu_{High \space Edu} = 0$
$H_{1}$: $\mu_{Low \space Edu} - \mu_{High \space Edu} > 0$
$\alpha$ = $0.05$
Where:
$\mu_{Low \space Edu}$ = Mean temperature of block groups with larger population with less education
$\mu_{High \space Edu}$ = Mean temperature of block groups with small population with less education

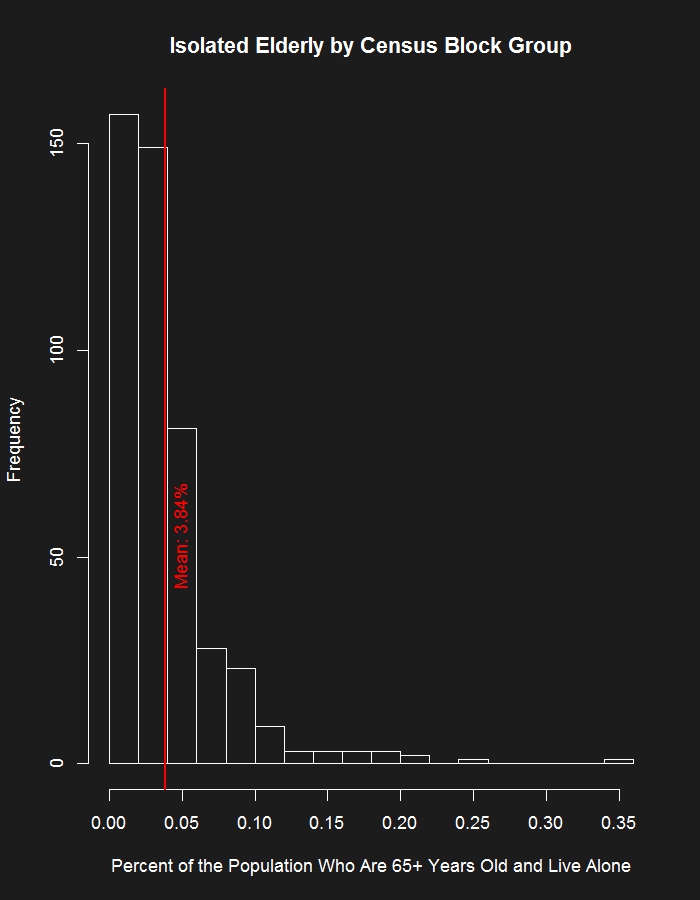
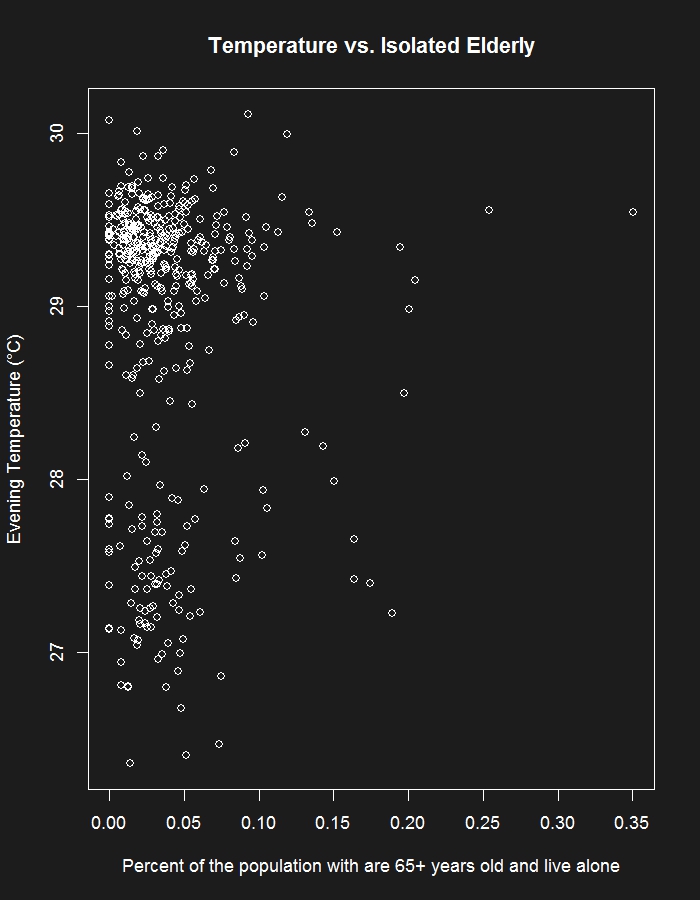
Isolated Elderly
Isolated Elderly: Geographic Distribution
Isolated Elderly: Hypothesis
$H_{0}$: $\mu_{Isolated \space Eld.} - \mu_{Accompanied \space Eld.} = 0$
$H_{1}$: $\mu_{Isolated \space Eld.} - \mu_{Accompanied \space Eld.} > 0$
$\alpha$ = $0.05$
Where:
$\mu_{Isolated \space Eld.}$ = Mean temperature of block groups with large population of isolated older adults
$\mu_{Accompanied \space Eld.}$ = Mean temperature of block groups with small population of isolated elderly
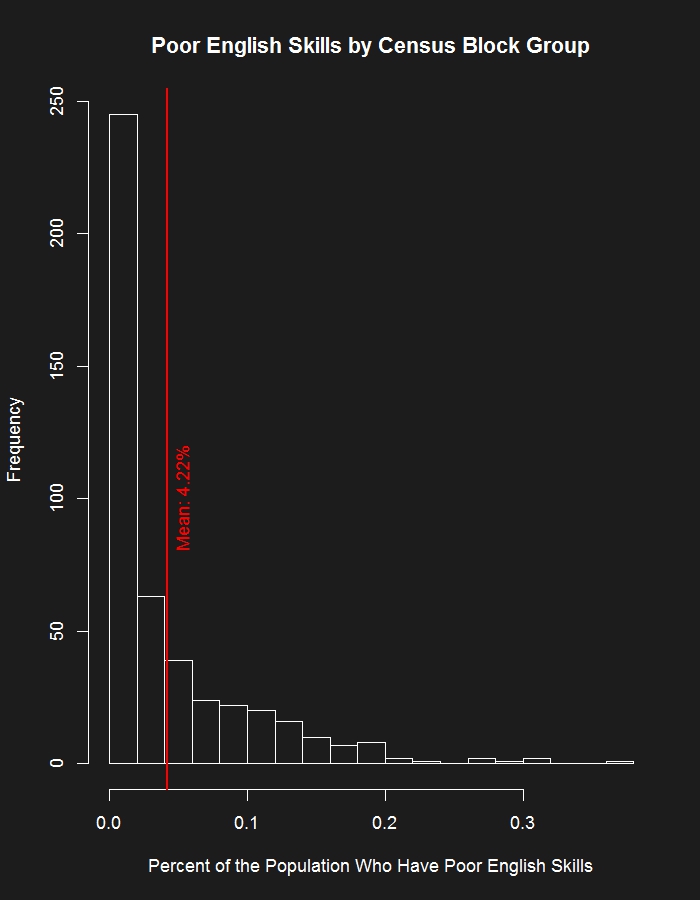
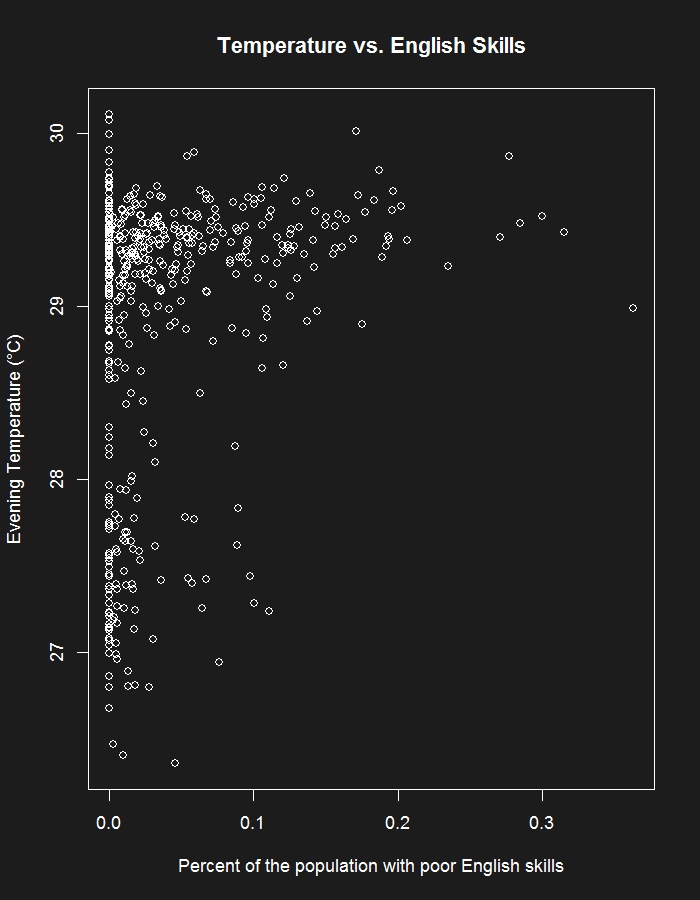
Poor English Skills
Poor English Skills: Geographic Distribution
Poor English Skills: Hypothesis
$H_{0}$: $\mu_{Poor \space Eng.} - \mu_{Good \space Eng.} = 0$
$H_{1}$: $\mu_{Poor \space Eng.} - \mu_{Good \space Eng.} > 0$
$\alpha$ = $0.05$
Where:
$\mu_{Poor \space Eng.}$ = Mean temperature of block groups with large population with poor english skills.
$\mu_{Good \space Eng.}$ = Mean temperature of block groups with small population with poor english skills.
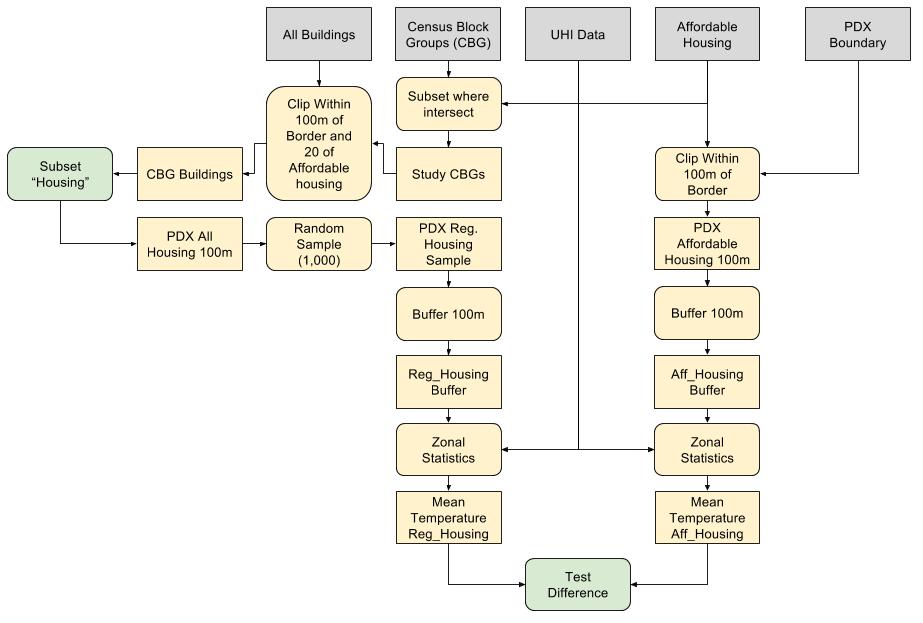
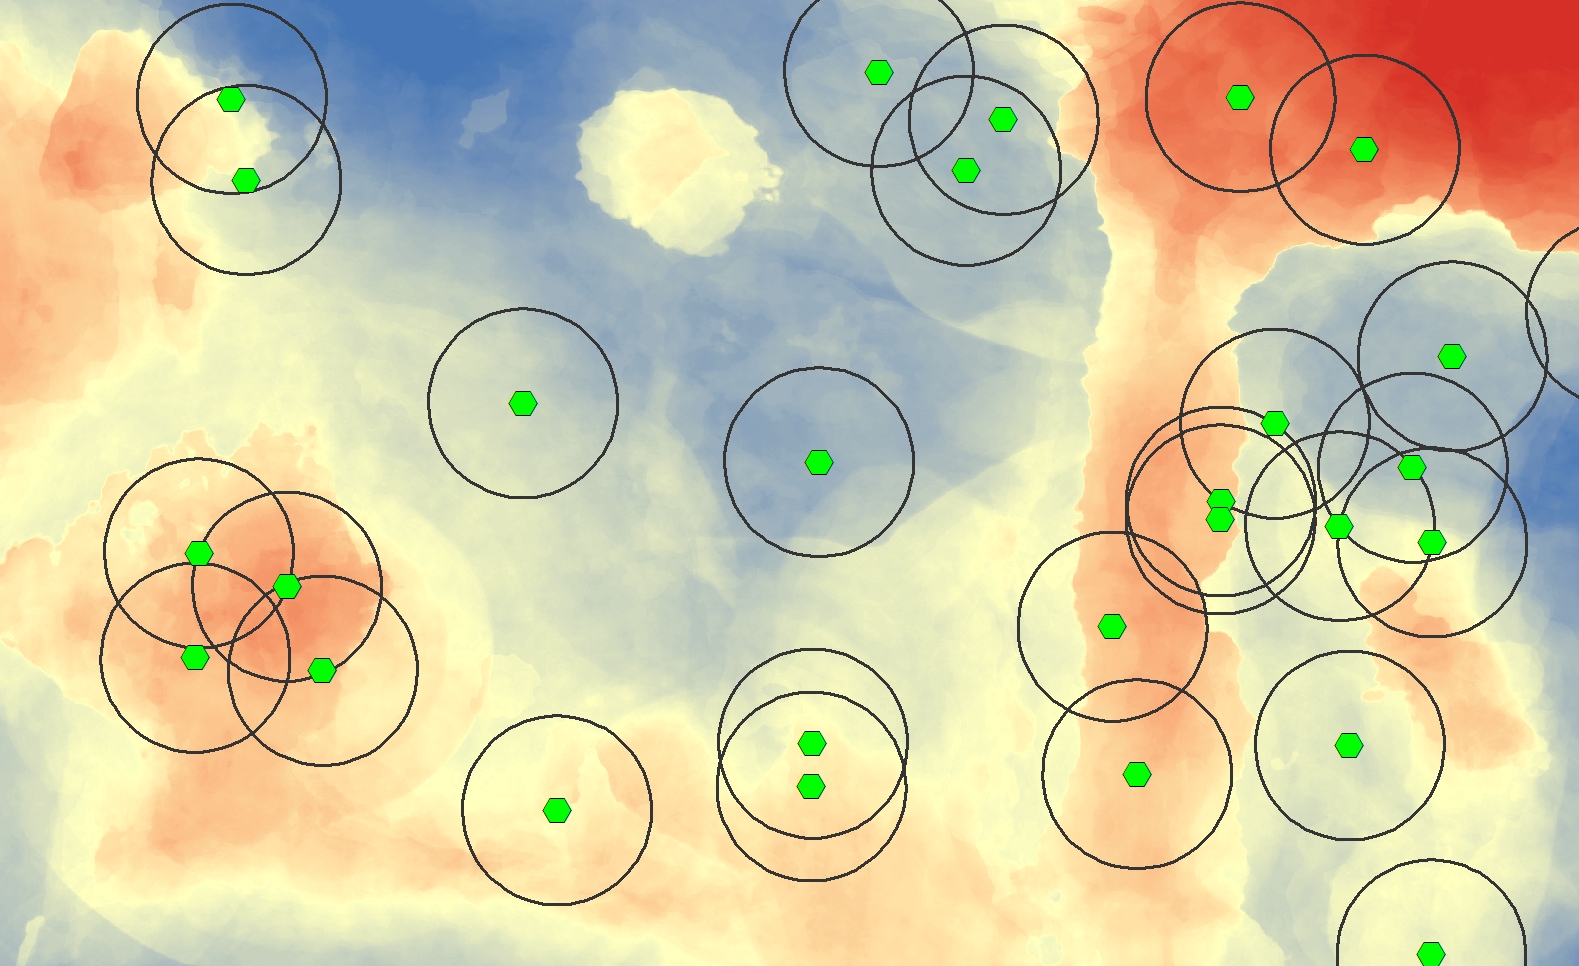
Building Level Analysis:
Affordable Housing
Affordable Housing: Hypothesis
$H_{0}$: $\mu_{AH} - \mu_{RH} = 0$
$H_{1}$: $\mu_{AH} - \mu_{RH} > 0$
$\alpha$ = $0.05$
Where:
$\mu_{AH}$ = Mean temperature within 100m of Affordable Housing
$\mu_{RH}$ = Mean temperature within 100m of Regular Housing
Affordable Housing: Workflow
Affordable Housing: Buffering
Results
Bifurcation of Continuous Variables
Normal Mixture Modelling (mclust in R)
Income
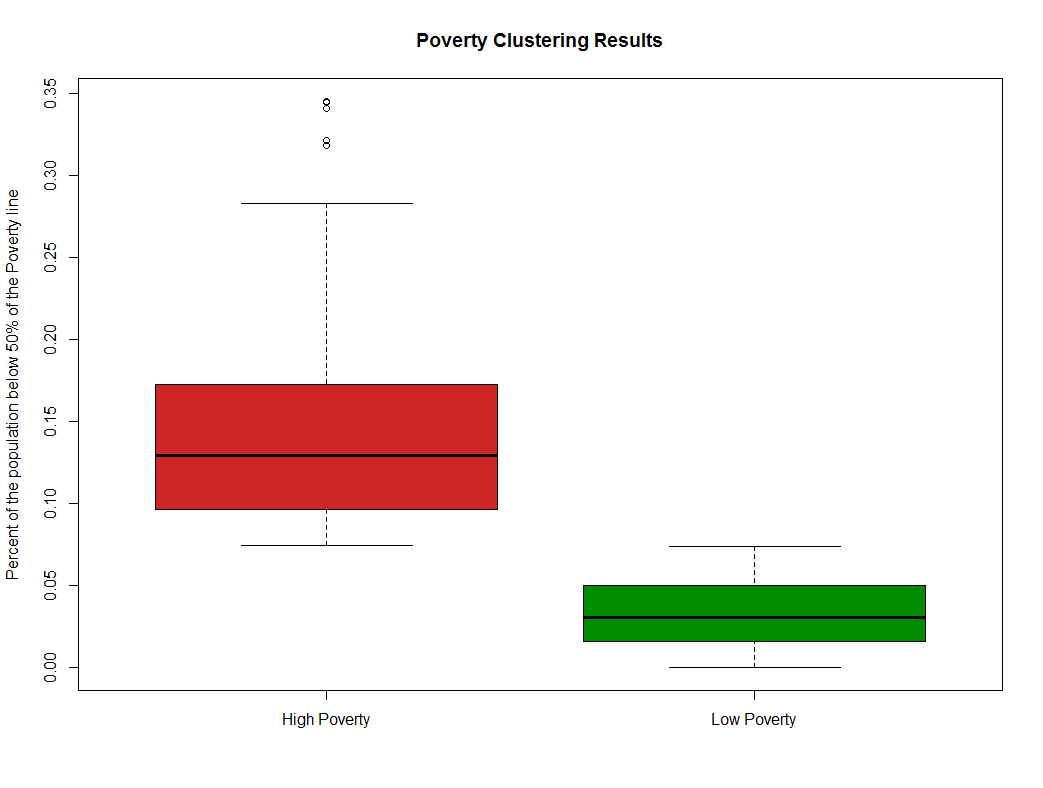
Income: Student's t-test Results
| t | P-Value | 95% Interval Low |
95% Interval High |
|---|---|---|---|
| 2.0848 | 0.0378 | 0.009°C | 0.317°C |
Result: Reject the Null Hypothesis
Race
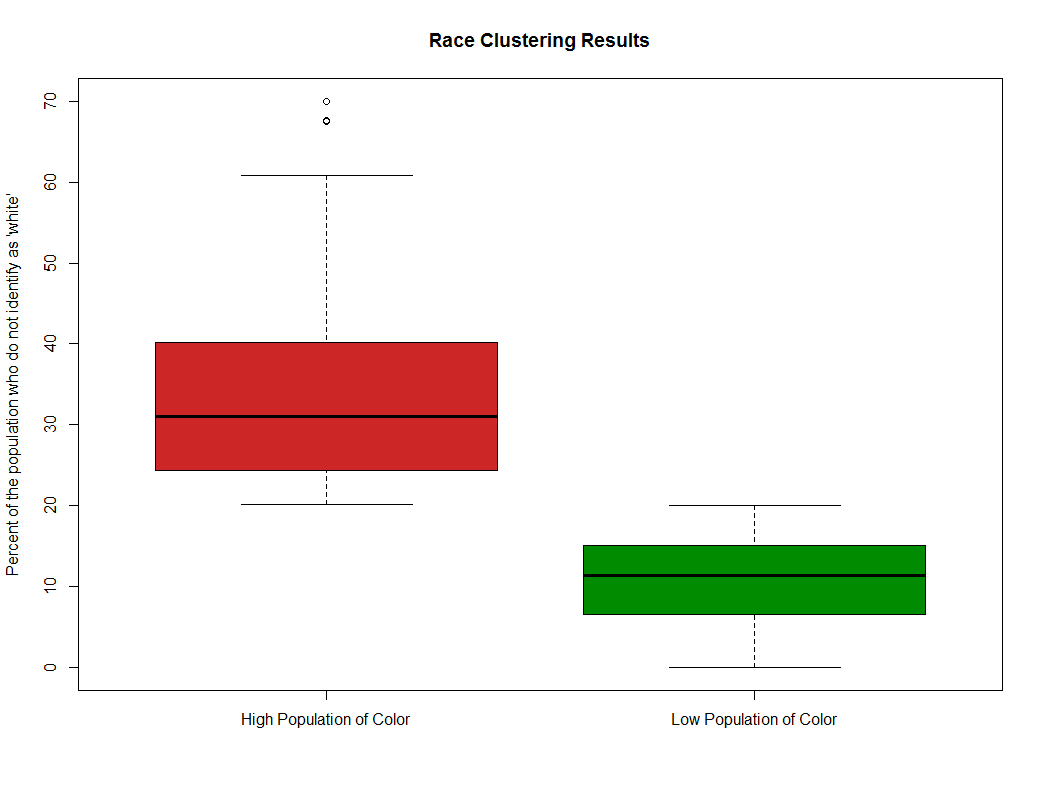
Race: Student's t-test Results
| t | P-Value | 95% Interval Low |
95% Interval High |
|---|---|---|---|
| 5.7579 | 1.565e-08 | 0.274°C | 0.558°C |
Result: Reject the Null Hypothesis
Education
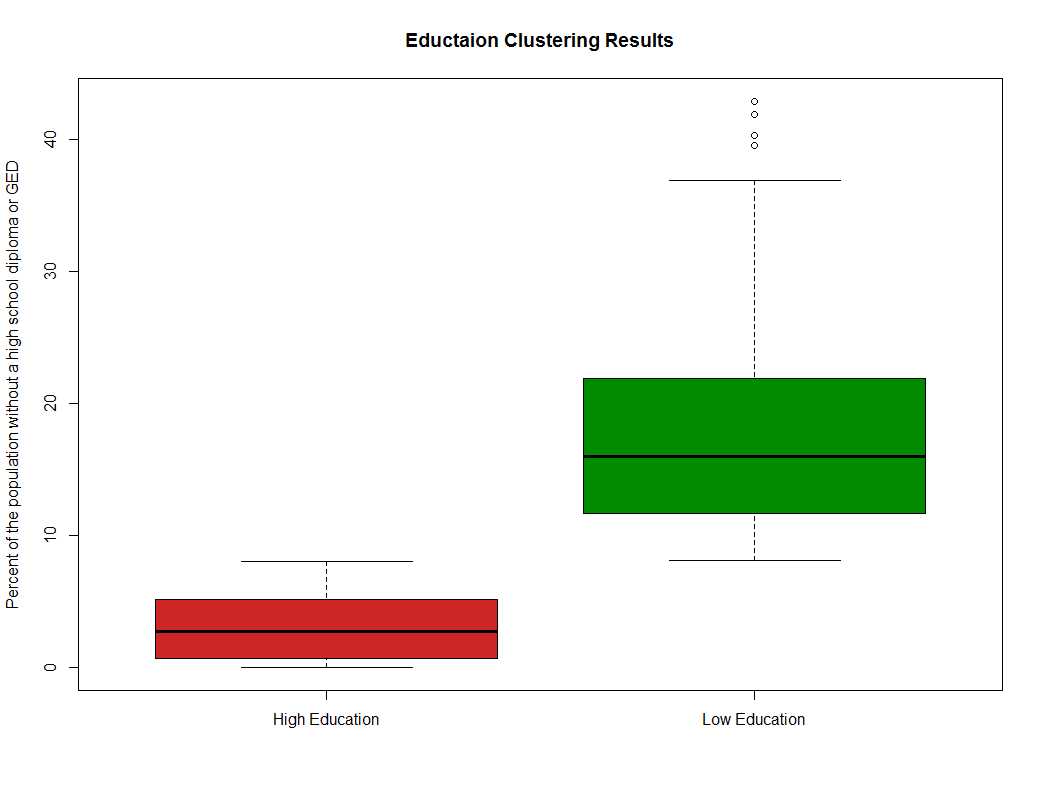
Education: Student's t-test Results
| t | P-Value | 95% Interval Low |
95% Interval High |
|---|---|---|---|
| 7.8371 | 3.359e-14 | 0.402°C | 0.672°C |
Result: Reject the Null Hypothesis
Isolated Elderly

Isolated Elderly: Student's t-test Results
| t | P-Value | 95% Interval Low |
95% Interval High |
|---|---|---|---|
| -0.0709 | 0.944 | -0.221°C | 0.206°C |
Result: FAIL to Reject the Null Hypothesis
Poor English Skills
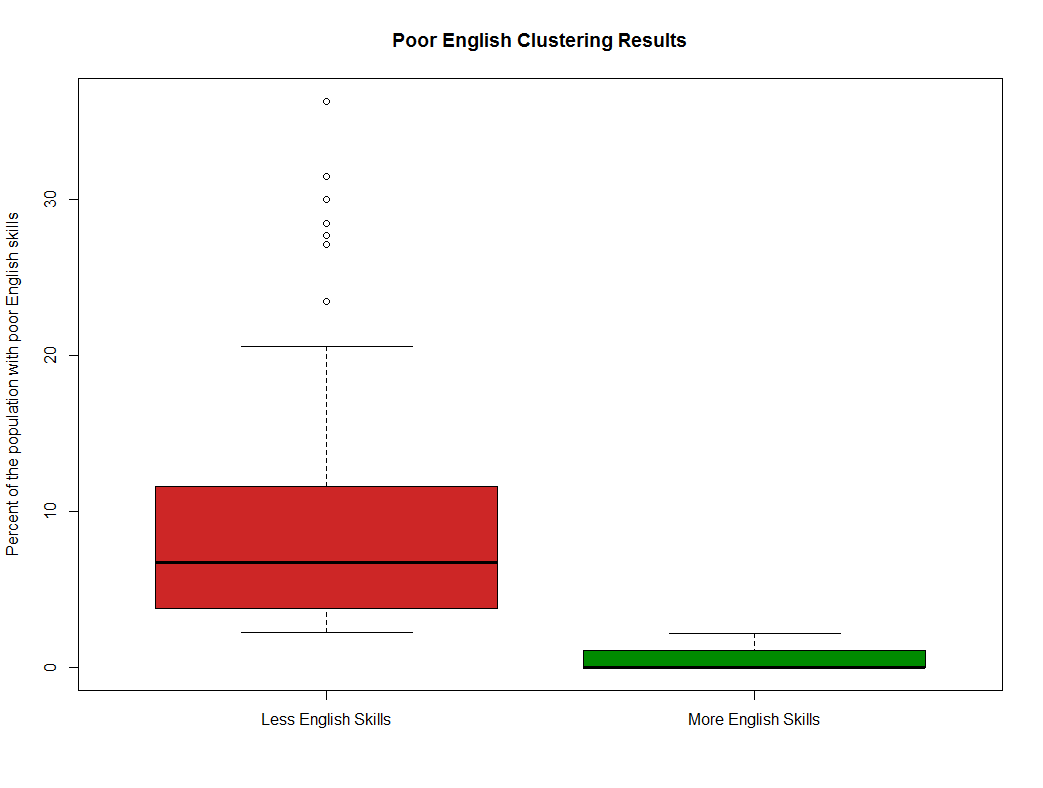
Poor English Skills: Student's t-test Results
| t | P-Value | 95% Interval Low |
95% Interval High |
|---|---|---|---|
| 6.0897 | 2.446e-09 | 0.297°C | 0.580°C |
Result: Reject the Null Hypothesis
Building Level Analysis:
Affordable Housing
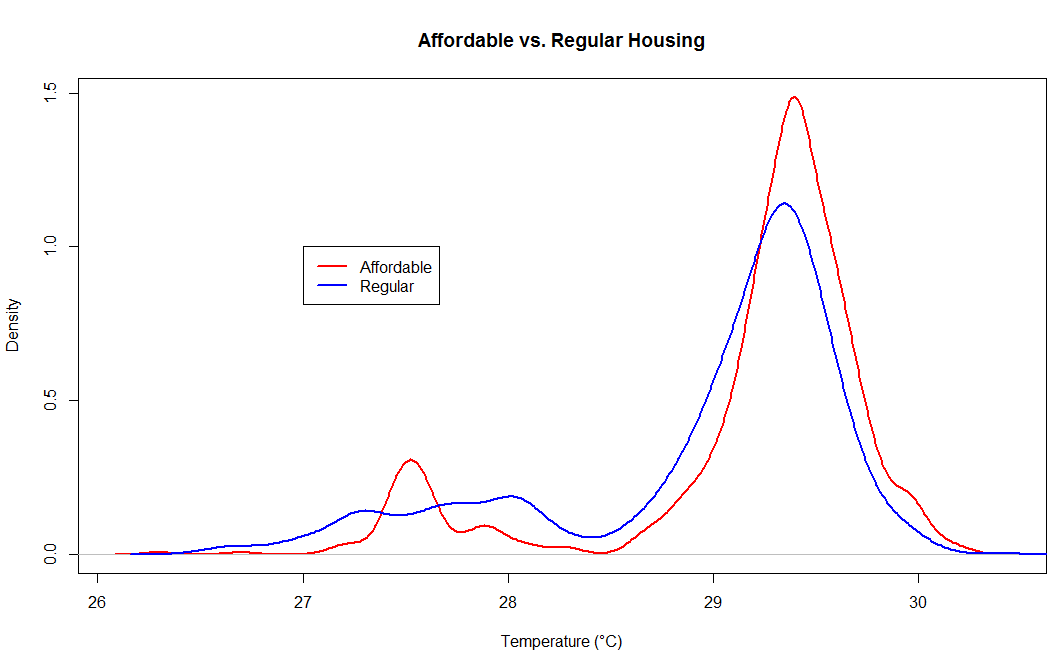
Building Level Analysis: Student's t-test Results
| t | P-Value | 95% Interval Low |
95% Interval High |
|---|---|---|---|
| 6.5439 | 7.852e-11 | 0.152°C | 0.282°C |
Result: Reject the Null Hypothesis
Conclusions
Lower Adaptive Capacity... Higher Exposure!
(Except for Isolated Elderly)
Is this vulnerability?
Not quite: what about sensitivity?
Sensitivity
- Such as:
- Age (old, young) - easy to get
- Obesity - hard to get (BMI from DMV... accurate?)
- Health Records - VERY hard to get (confidentiality)
Policy implications
- Fundamentals of environmental justice are being violated, however heat is often forgotten
- Targeting communities during heatwaves:
- Cooling Centers
- Movie Tickets
- Door hangers: lack of heat education
- Mitigation through green infrastructure: urban trees
Urban Trees
- Major factor in heat
- Other benfits:
- Reduction of PM2.5 (Nowak, Hirabayashi, Bodine, & Hoehn, 2013)
- Reduction of PM10 (Bealey et al., 2007)
- Reduction of NO2 (Rao, George, Rosenstiel, Shandas, & Dinno, 2014)
- Strongly associated with higher income in Portland, Oregon
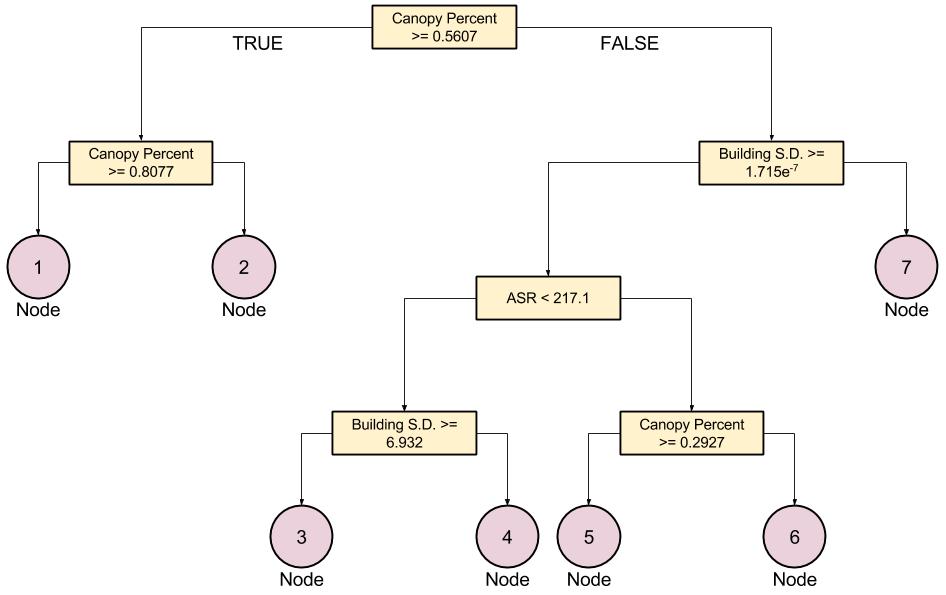
Future Research:
- Change clustering
- Non-Linear Modeling
- CART / MLR Hybrid (Hart & Sailor, 2008)